US–Canada Gas and Power Costs: Regional Basis, Portfolio Exposure and Tariff Lag
Follow a regional gas shock through hedged electricity procurement and an industrial bill, with explicit USD/CAD conversion and timing.
AI-generated editorial illustration; it does not depict a verified project, actual prices or chart data.
1. Economic decision and cost boundary
Industrial buyers in the United States and Canada share connected gas markets but do not share one electricity tariff. A hub price, a city's delivered gas basis, a generator's fuel requirement and the utility's procurement portfolio are different economic objects. A supplier may be exposed to gas while the customer's bill changes only after a fuel adjustment, contract reset or regulatory reconciliation. The useful question is therefore how much of the gas shock reaches a particular delivered MWh, when it arrives, and which cash flow is denominated in CAD or USD. A hydro-dominated system, a gas-linked power contract and a fixed retail offer can respond differently without any contradiction in the underlying gas data.
2. Dated North American evidence
EIA's 9 September publication reports Algonquin Citygate trading 0.43 USD/MMBtu below Henry Hub during April–July 2026, with Canadian net flows into New England averaging 0.4 Bcf/d. Those are earlier-period observations, not September spot prices. The 2 October production article's 137 Bcf/d for July is gross withdrawal, not saleable dry gas. Processing and regional deliverability separate a production headline from fuel available to a particular generator. EIA's 3 September load report gives ERCOT weekly averages 74.5 GW for the week ending 22 August and 73.7 GW for 29 August. Neither is an instantaneous equipment-design peak. These reports establish regional and temporal boundaries; they do not supply the hypothetical tariff parameters below. EIA attributes the New England price data to Natural Gas Intelligence and the Canadian flow data to S&P Global Energy.
3. Worked model and assumptions
Assume a buyer imports 2000 MWh in one month. Its supplier's relevant portfolio is 40% gas-linked, the associated generation requires 7 MMBtu/MWh,50% of the relevant exposure is hedged for this period, and 60% of the remaining fuel change passes into the buyer's energy charge. For an assumed gas increase of 1 USD/MMBtu, passed cost =0.40×7×(1−0.50)×0.60×1=0.84 USD/MWh. Monthly exposure is 2000×0.84=1680 USD, or 2392.32 CAD at 1.4240 CAD/USD. The portfolio share and pass-through are accounting assumptions, not estimates of a national gas generation share. A marginal market price can move more than this average-cost bridge.
4. Sensitivity, units and interpretation
When hedge coverage becomes 0%, the same shock passes 1.68 USD/MWh, producing 3360 USD or 4784.64 CAD per month. With an assumed 2 USD/MMBtu shock and no hedge, exposure doubles to 3.36 USD/MWh,6720 USD or 9569.28 CAD. Do not add a hedge settlement to these charges without knowing who owns it: the modeled hedge already reduces exposed fuel. If reconciliation arrives later, assign the cost to its actual settlement month rather than the gas observation month. A quarterly portfolio may contain different fixed and indexed volumes; match hedge coverage to that eligible volume, not to total annual plant consumption.
5. Engineering and procurement decision
Regional basis requires a separate review. A summer discount in New England does not guarantee a winter discount, and a Canadian producer's low upstream cost does not establish the citygate delivery price. Transport reservation, congestion, storage withdrawal and heating demand change the link. For a Canadian quote in CAD/GJ versus a U.S. quote in USD/MMBtu, first reconcile energy units and heating-value basis, then convert currency. Transformer planning needs interval load, ambient temperature and contingency requirements; a weekly regional average cannot replace them. Approve a purchasing response only after the contractual adjustment window, measured MWh, actual hedge rights and billing determinants are identified. Efficiency reduces the exposed energy quantity; it does not automatically erase fixed network or capacity charges.
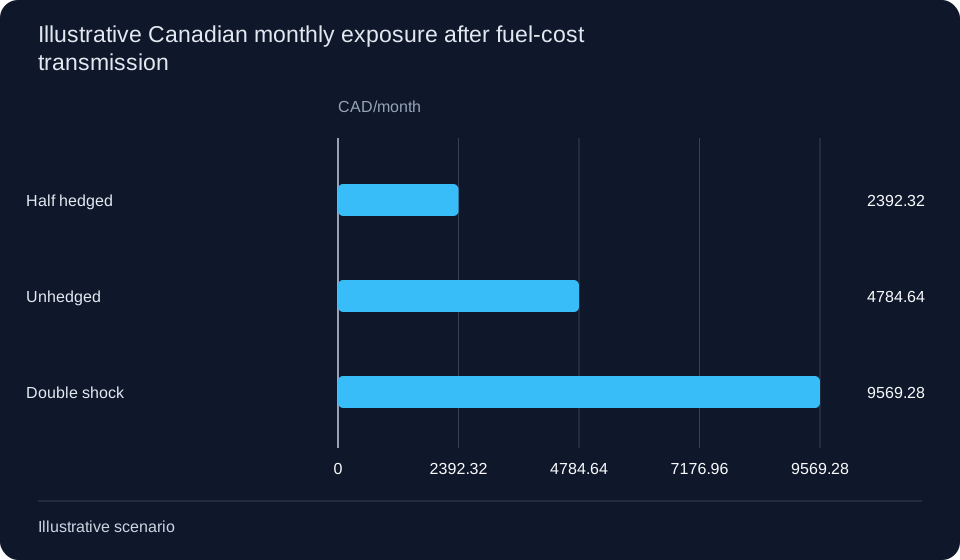
2000 MWh/month; gas-linked share 40%, heat rate 7 MMBtu/MWh, pass-through 60%. Cases vary gas shock 1/1/2 USD/MMBtu and hedge coverage 50%/0%/0%. FX 1.4240 CAD/USD held fixed; these are scenarios, not Canadian tariffs.
| Illustrative case | Gas shock USD/MMBtu | Hedge coverage | Passed cost USD/MWh | Monthly USD | Monthly CAD |
|---|---|---|---|---|---|
| Half hedged | 1 | 50% | 0.84 | 1680 | 2392.32 |
| Unhedged | 1 | 0% | 1.68 | 3360 | 4784.64 |
| Double shock, unhedged | 2 | 0% | 3.36 | 6720 | 9569.28 |
6. Method and limitations
This analysis is an engineering procurement comparison valued on 9 October 2026. Money is nominal, and USD and CAD remain distinct throughout the ledger. The quoted Bank of Canada rate is an indicative daily observation for 8 October: 1 USD = 1.4240 CAD. It is not a guaranteed execution rate, a monthly average, or an assumption about future currency performance. For a CAD payable expressed in USD, divide by CAD per USD; for a USD payable expressed in CAD, multiply. Apply the exchange rate to the relevant complete cash flow and date, rather than to a conveniently selected material or fuel line.
Keep three kinds of information separate. A publication dated within August–October can report an earlier observation period. An announced fee has an effective date and eligible charge base. A long-range scenario describes a conditional future, not an approved project or current installed capacity. The worked model uses explicitly stated illustrative quantities and prices; it does not claim to reproduce a particular utility, mine, manufacturer or carrier invoice. No full-month October observation is invented. Where an engineering parameter is held constant, the comparison isolates one mechanism rather than predicting operational behaviour.
The decision record should contain dated quotations, meter or quantity records, technical acceptance criteria, payment dates and the exact commercial adjustment clause. Separate gross input from net usable output and preserve any revenue, scrap or fuel recovery credit on its own basis. Allocate recurring and one-time costs before comparing unit prices. If two alternatives offer different reliability, capacity, warranty or timing, they are not equivalent just because the table places them beside each other. Add a quantified adjustment or state the unresolved difference before making a purchasing decision.
Round only the displayed result after calculation. Taxes, duties, financing and disruption costs must be included when they are actually payable, but the hypothetical examples exclude any item not explicitly listed. A benchmark escalation already embedded in an offer must not be added again. Stress cases carry no assigned probability. Recheck the model when the exchange rate, index observation window, physical quantity, technical design or supplier scope changes. The result is a reproducible project comparison, not investment advice or a forecast of securities prices.
7. Frequently asked questions
Is the table a forecast of Canadian electricity? No. It isolates a contract-specific fuel transmission mechanism with illustrative portfolio parameters.
Can a regional gas discount be used as a universal factory saving? No. Delivery location, season, fuel unit and tariff must match.
Does record gross gas guarantee cheap power? No. Processing, pipeline access, demand, portfolio timing and grid charges remain separate.
8. Primary sources
- EIA North American energy analysis
- EIA North American energy analysis
- EIA North American energy analysis
- Bank of Canada daily exchange rates
9. Connected news and technical articles
- Gross gas production and processing boundary
- New England gas basis and Canadian flows
- ERCOT weekly load and planning boundary
- Montney productivity and delivered-cost boundary
- Canadian Oil Netbacks: Pipeline, Rail and the Hidden Diluent Denominator
- North American Critical Minerals: Battery Duration and the Cost of Qualified Grid Equipment
- US–Canada Equipment Procurement: Rail Fuel Fees, Currency and the Quote That Changes Rank
- US–Canada Gas and Power Costs: Regional Basis, Portfolio Exposure and Tariff Lag
- Canadian Oil Netbacks: Pipeline, Rail and the Hidden Diluent Denominator
- North American Critical Minerals: Battery Duration and the Cost of Qualified Grid Equipment
- US–Canada Equipment Procurement: Rail Fuel Fees, Currency and the Quote That Changes Rank
- From Oil and Gas Benchmarks to Factory Power Costs: August–October 2026
- Mining Revenue and Processing Margins: Why Rising Metals Can Still Squeeze Costs
- Energy Equipment Landed Cost: Diesel Indexation, Route Changes and Delay Financing
- Industrial Electricity Bills: Energy, Network and Demand Costs in 2026
- EU–US Industrial Power Prices: Match Tax, Currency and Delivery Basis
- Natural Gas and LNG: From Hub Benchmark to Delivered Industrial Cost
- Brent, WTI and Refinery Energy Costs: A Margin Scenario Bridge
- Transformer Procurement: A Copper, Aluminium, Oil and Currency Cost Bridge
- Copper and Aluminium Winding Costs: Metal Pass-Through and Indexation in 2026
- GOES Electrical Steel Economics: Yield, Loss and Grade Premium in 2026
- Mineral Oil versus Natural Ester: Transformer Life-Cycle Cost Boundaries in 2026
- Lithium, Nickel and Graphite Exposure: Battery Procurement Cost Bridges in 2026
- Recycled Copper Economics: Quality, Recovery Yield and Energy Cost in 2026
- Transformer landed cost: Incoterms, ocean freight, road delivery and insurance in 2026
- Transformer heavy haul: route, permits, storage and remobilization costs
- LNG shipping economics: freight, boil-off and delivered energy cost
- Port delay economics: working capital, storage and equipment demurrage
- Diesel and bunker freight surcharges: an auditable indexation model
- Solar LCOE: Financing, Curtailment and Interconnection in 2026
- Wind Capture Price: Congestion, Export Losses and Revenue
- BESS Arbitrage: Throughput, Degradation and Net Spread
- Industrial Power PPAs: Fixed, Floating and Profile Risk
- Transformer Losses: Capital Premium, Electricity Cost and NPV
- Refinery hydrogen: separate gas, electricity and carbon costs
- LNG liquefaction: electric-drive versus gas-turbine energy cost
- Oilfield ESP economics: water cut changes the oil-cost denominator
- Gas-generator spark spread: net heat rate turns fuel into cost
- Liquid-pipeline pumping: electricity versus diesel cost scenarios
- Copper Mine Energy Cost: Grade and Recovery Matter More Than a Headline Tariff
- SAG Mill Economics: Lower kWh/t Must Preserve Throughput and Recovery
- Mine Conveyor or Haul Trucks: Energy Prices and the Throughput Break-Even
- Mine Dewatering Cost: Total Head and Wire-to-Water Efficiency
- Mine Power Reliability: Value Outage Hours, Restart Losses and Backup Costs Separately
- SFRA After Transformer Transport: Distinguishing Winding Movement from a Changed Setup
- Transformer Moisture: Why the Same ppm Means Different Risk in Mineral Oil and Ester
- Bushing Capacitance and tan δ: Build a Temperature-Consistent Trend Before Replacement
- OLTC Dynamic Resistance: Diagnose Transition-Resistor Signatures Without False Alarms
- Transformer Winding Resistance: Correct Temperature Before Comparing Phases and Factory Data
- Restricted Earth Fault: Proving the Transformer Neutral CT Zone
- GOOSE with PRP or HSR: Supervise the Trip, Not Just the Link
- 1 A or 5 A CT Secondaries: Calculate the Long-Cable Burden
- MV Breaker Failure 50BF: Build the Timer and Intertrip Budget
- NGR Continuity Monitoring: Respond to an Open or Bypassed Resistor
- BESS Transformer RFQs: Evaluate Losses Against the Actual Duty Cycle
- MV Collector Protection When Inverter Fault Current Barely Exceeds Load
- Grid-Forming BESS Black Start: Prove Transformer Energization Before Load Pickup
- Dual-LV Solar Transformers: Specify Every Pairwise Impedance and Its Base
- Renewable Collector Harmonic Scans: Include Cable Capacitance and Converter Impedance
- Refinery Voltage-Sag Ride-Through: Coordinating VFDs, Contactors and Process Permissives
- LNG Compressor Starting: A Transformer Study for Voltage Dip and Acceleration
- ESP Drives, Step-Up Transformers and Long Cables: Separating Resonance from Voltage Drop
- Pressurized Electrical Rooms in Hazardous Areas: Purge, Pressure-Loss and Trip Interfaces
- Refinery UPS Selectivity: Static Bypass, Inverter Limits and Branch Fault Clearing
- Underground Trailing Cables: Coordinate Ground Check and Neutral Protection
- Downhill Conveyor Regeneration: Specify the Transformer and Grid Interface
- Mine Hoist Transformers: Use RMS Cycle Screening Without Hiding Hot Spots
- SAG Mill Drive Transformers: Coordinate Harmonics, Filters and Network Impedance
- High-Altitude Mining Transformers: Separate Clearance and Cooling Guarantees
- Short-Circuit Test Reports: Proving Similarity to the Offered Transformer
- Transformer Noise Guarantees: Sound Power, Sound Pressure and Acceptance
- Ester Retrofill Review: Gaskets, OLTC Approval and the Remaining Mineral Oil
- Reusing a 50/60 Hz Transformer: V/Hz Is Only the First Check
- EU F-Gas Switchgear Procurement in 2026: Rated Voltage and Evidence Scope
- Ecodesign Tier 2 Transformer Standards: No-Load and Load-Loss Limits
- No-Load Loss (P0) Reduction Physics: Laser-Scribed CRGO vs Amorphous Alloy Cores
- Transformer Load Loss (Pk) Optimization: CTC Conductors and Stray Loss Mitigation
- Cast Resin Dry-Type vs Liquid-Immersed Transformers: Selection Guide
- Forced Air (AF) Cooling Dynamics in Cast Resin Transformers: +40% Power Uprating
- Partial Discharge (PD) Testing and Diagnostics in Cast Resin Transformers
- Ester Dielectric Fluids in Power Transformers: Natural vs Synthetic Esters vs Mineral Oil
- Transformer Thermal Modeling and Winding Hot-Spot Calculation (IEC 60076-2 / IEC 60076-7)
- Conservator Preservation Systems, Buchholz Relays, and DGA Duval Triangle Diagnostics
- Step-Up Transformer Engineering for Utility Solar PV, Wind and BESS Plants
- Wind Turbine Nacelle and Tower Transformers: 3G Vibration and Marine Corrosion Design
- BESS Battery Energy Storage Coupling Transformers: Four-Quadrant P-Q Operation and dV/dt Stresses
- Substation Step-Down Power Transformers (110 kV to 330 kV): Design & OLTC Regulation
- On-Load Tap Changer (OLTC) Vacuum Technology and Automatic Voltage Regulation (AVR)
- Ultra-High Voltage (UHV 1000 kV) Transformers and SCB18 Dry-Type Technology
- Generator Step-Up (GSU) Transformers: Saturation, Overfluxing (V/Hz), and Tertiary Stabilizing Windings
- Heavy Industry Process Transformers: Electric Arc Furnace (EAF) & Green Hydrogen Rectifiers
- Variable Frequency Drive (VFD) Multi-Pulse Isolation Transformers: Harmonic Cancellation
- Grounding Transformers (Zigzag ZN) and Neutral Earthing Resistors (NGR): Sizing & Fault Duty
- Medium Voltage Switchgear Selection: Air-Insulated (AIS) vs Gas-Insulated (GIS)
- Vacuum Circuit Breaker (VCB) Switching Dynamics: Transient Recovery Voltage (TRV) and RC Snubbers
- Ring Main Units (RMU) for Secondary Distribution: Architecture, CCF Topologies, and Telemetry Automation
- Transformer Differential Protection (ANSI 87T): Biased Slope, Inrush Restraint, and CT Saturation
- IEC 61850 Substation Automation: GOOSE Messaging, Sampled Values (SV), and Process Bus Protection
- Prefabricated and Pad-Mounted Substations: IEC 62271-202 Selection Guide
- Diesel and Gas Generator Sets: ISO 8528 Rating and Selection Guide
- Instrument Transformers: CT and VT Selection for Metering and Protection
- Surge Arresters and Insulation Coordination: IEC 60099-4 / IEC 60071 Guide
- Power Quality and Reactive Compensation: Capacitor Banks, SVC and STATCOM
- Medium-Voltage Cables and Busways: Ampacity, Voltage Drop and Short-Circuit Selection
- Industrial Motor Selection: IEC 60034 Ratings, Starting and IE Efficiency
- UPS, BESS and Critical Power: Autonomy, Topology and Safety Selection
- Transformer FAT and Site Commissioning: IEC 60076 Test Plan
- Mobile Emergency Substations: Rapid Deployment and Interface Selection
- Rail Traction Transformers: AC/DC Supply, Regeneration and Vibration Duty
- Shore Power Transformers: IEC/IEEE 80005-1 HVSC Interface Design
- Mining and Flameproof Transformers: Ex-Zone, Cooling and Protection Selection
- LV Power Switchboards: IEC 61439 Design Verification and Assembly Data
- LV Breakers, Switches, Fuses and Contactors: IEC 60947 Coordination
- Automatic Reclosers and Feeder Automation: IEC 62271-111 Selection
- MV Feeder Protection Settings: 50/51, 67, 79 and IEC 60255 Evidence
- Generator ATS, AMF and Paralleling: ISO 8528 and IEC 60947-6-1
- Power Meters and Power-Quality Monitoring: IEC 61557-12 / 61000-4-30
- PV Inverter Grid Connection: Anti-Islanding, Reactive Power and Transformer Interface
- EV Charging Infrastructure: Transformer Sizing, Protection and IEC 61851
- Pad-Mounted Transformers: Dead-Front Loop-Feed Design, Fusing and IEEE C57.12.26
- Monoblock Concrete Substations: Internal Arc (IAC-AB), Ventilation and IEC 62271-202
- Biogas and Landfill CHP Gensets: Fuel Gas Treatment, Methane Number and ISO 8528
- Synchronous Generator Protection and Grid Code Compliance: ANSI 32, 40, 46, 81 and FRT
- Electrostatic Shielded Solar Transformers: Inverter Harmonics, K-Factor and Ester Oil
- Busbar Differential Protection (ANSI 87B): High-Impedance vs Distributed Numerical Architecture
- Transmission Autotransformers: Delta Tertiary Stabilization, Zero-Sequence Impedance and Sizing
- Amorphous Metal Core Transformers: Fe-Si-B Ribbon Physics, Acoustic Design and Life-Cycle TOC
- Subsurface and Vault-Mounted Distribution Transformers: Flood Protection and IEEE C57.12.40
- Emergency Diesel Generator Fast-Starting: ISO 8528-5 Class G3 Dynamics and NFPA 110
- Submerged Arc Furnace (SAF) Transformers: High-Current Secondary Bus Electrodynamics
- Floating Solar PV (FPV) Transformer Substations: Marine Corrosion, Buoyancy and Tilt
- ETAP Alternative for Single Line Diagrams: A Practical Selection Guide
- How to Create an Electrical Single Line Diagram Online
- Single Line Diagram vs Load-Flow Model: Validation Before Analysis