From Oil and Gas Benchmarks to Factory Power Costs: August–October 2026
A regional fuel-to-power bridge separates observed gas benchmarks, the October oil forecast and a plant-specific cost scenario.
AI-generated editorial illustration; it does not depict a verified project, actual prices or chart data.
1. Economic decision
An industrial buyer can receive higher oil prices, a modest domestic gas movement and a much larger imported-gas movement in the same month. There is no single energy escalation factor that safely converts those signals into the factory budget. Build a transmission bridge: benchmark, delivered fuel, conversion efficiency, purchased power and production cost. Each boundary has its own units, commercial terms and timing. For a plant choosing between purchased electricity and on-site generation, the relevant comparison is avoidable delivered cost at the same operating hour, rather than a commodity chart against an average electricity invoice.
2. Evidence and observation period
The World Bank publication dated 2 October supplies August and September gas observations used below. Its U.S. series is Henry Hub; its European series is Netherlands TTF. The EIA outlook released 6 October forecasts fourth-quarter Brent at 105 USD/bbl. That oil figure is a forecast and is not inserted into the gas formula. Oil matters through backup fuel, transport and potentially indexed supply agreements, but the size and lag of each channel must come from the contract. The two gas series represent different locations and market boundaries; their divergence does not establish an arbitrage profit.
3. Worked engineering model
Consider an illustrative gas generator producing 1000 MWh during a month with a constant 7.5 MMBtu/MWh heat rate. Required thermal input is 1000×7.5=7500 MMBtu. Benchmark-linked fuel cost therefore equals electricity output×heat rate×gas price. The U.S. benchmark case changes from 20775 to 22125 USD, an increase of 1350 USD/month or 1.35 USD/MWh. Holding the same engineering assumptions, the European benchmark case changes from 158325 to 190650 USD, an increase of 32325 USD/month or 32.325 USD/MWh. These are parallel regional calculations, not a claim that one plant can buy either benchmark at will.
A useful reverse test asks how much price exposure a generation-efficiency improvement removes. Reducing heat rate from 7.5 to 7.0 MMBtu/MWh saves 500 MMBtu per 1000 MWh. At September Henry Hub that is 1475 USD; at September TTF it is 12710 USD. These amounts are gross benchmark fuel savings before maintenance, capital recovery, part-load performance and availability. The same heat-rate improvement has very different monetary value across regions. A technology recommendation must also test reliability, permit constraints and the actual delivered gas tariff before using either amount in an investment appraisal.
Do not substitute thermal efficiency directly for heat rate without reconciling higher versus lower heating value. Using 3.412 MMBtu/MWh for electrical energy, the illustrative 7.5 heat rate corresponds to approximately 45.5% conversion efficiency on the matching energy basis. At lower load, actual heat rate can rise. Starts, warm-up fuel and standby consumption can raise the monthly fuel bill without raising metered generation proportionally. For a measured fleet, divide metered thermal input by net exported MWh over the same interval and document which auxiliaries are inside the boundary.
Procurement should separately record pipeline transport, balancing, capacity, taxes and network charges. A wholesale electricity forecast cannot replace those invoice lines. If a generator operates only during expensive grid hours, compare its hourly incremental fuel and variable operating cost with the avoided hourly grid charge; reserve fixed capacity benefits for cases where the contract actually allows them. For equipment purchases, evaluate loss reductions against future delivered electricity scenarios and production hours. The immediate review trigger is a changed contractual gas index or measured heat rate, followed by an updated dispatch comparison.
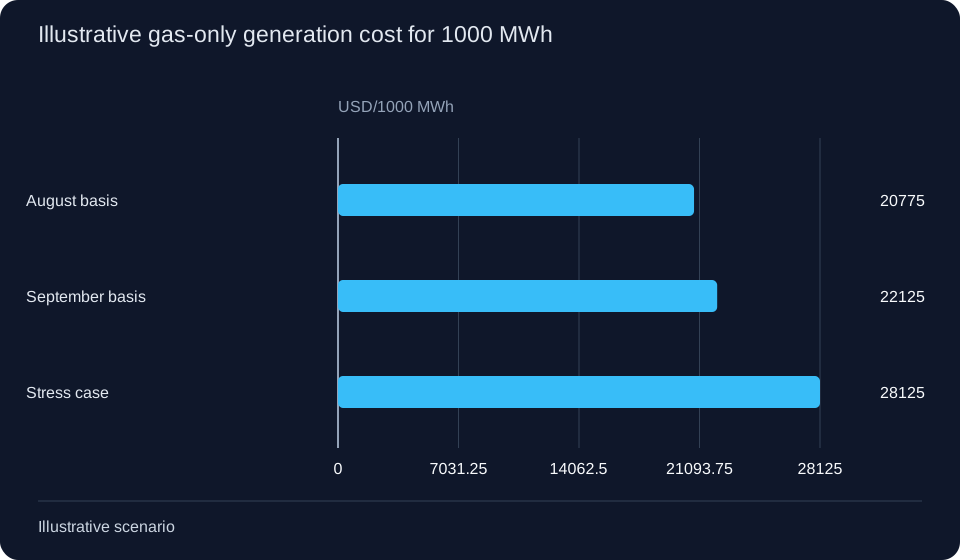
Heat rate 7.5 MMBtu/MWh; August Henry Hub 2.77, September 2.95 and stress 3.75 USD/MMBtu. These benchmark-linked calculations exclude delivery, operations and grid charges; the stress price is an assumption.
| Case and basis | Fuel USD/MMBtu | Gas-only USD/MWh | Total USD/1000 MWh |
|---|---|---|---|
| August Henry Hub, observed benchmark | 2.77 | 20.775 | 20775 |
| September Henry Hub, observed benchmark | 2.95 | 22.125 | 22125 |
| Stress, illustrative assumption | 3.75 | 28.125 | 28125 |
| August TTF, observed benchmark | 21.11 | 158.325 | 158325 |
| September TTF, observed benchmark | 25.42 | 190.650 | 190650 |
Frequently asked questions
Does higher Brent automatically increase electricity cost? Only where an identifiable fuel, transport or indexation channel connects the two. Gas and grid contracts require separate evidence.
Can the TTF case be treated as a European factory tariff? No. It is a benchmark-linked generation scenario before local delivery, grid and other charges.
Why use equal output in each case? It isolates price transmission. A separate production scenario should vary output and efficiency together when operations justify it.
Method, uncertainty and procurement controls
All money in the worked examples is nominal USD at the stated period; none is inflation adjusted. The valuation date is 9 October 2026. Observed monthly benchmarks describe August or September, the EIA outlook is a source forecast released on 6 October with inputs closed on 1 October, and the worked engineering cases are explicitly illustrative scenarios. No complete October monthly average is available at this cut-off. A source revision, a delivery premium, a different tax treatment or a currency conversion can change the calculation without changing its logic.
Preserve the supplier quotation, the contractual index name, the averaging window and the index publication alongside the calculation. A procurement analyst should be able to reproduce every multiplication from the same records. Keep quantity, efficiency, availability and currency exposure in separate cells. If prices are denominated in another currency, translate the complete agreed cash flow using a dated exchange-rate assumption; do not translate only the fuel component. Recoverable taxes are excluded, while financing, nonrecoverable taxes and disruption penalties require additional project-specific lines.
A sensitivity is a conditional calculation, not a probability-weighted forecast. Vary one input to locate the exposure, then combine inputs only when their dependence is documented. Do not add an upstream price shock to a supplier increase if the quotation already includes that shock. Before approval, reconcile the result to a real meter, bill of materials, fuel log or freight quotation and define the event that causes a new review.
Primary sources
- EIA October 2026 outlook
- World Bank October 2026 commodity prices
- EIA energy conversion methods
- EIA electricity price components
Related news and connected analysis
- From Oil and Gas Benchmarks to Factory Power Costs: August–October 2026
- Mining Revenue and Processing Margins: Why Rising Metals Can Still Squeeze Costs
- Energy Equipment Landed Cost: Diesel Indexation, Route Changes and Delay Financing
- Industrial Electricity Bills: Energy, Network and Demand Costs in 2026
- EU–US Industrial Power Prices: Match Tax, Currency and Delivery Basis
- Natural Gas and LNG: From Hub Benchmark to Delivered Industrial Cost
- Brent, WTI and Refinery Energy Costs: A Margin Scenario Bridge
- Transformer Procurement: A Copper, Aluminium, Oil and Currency Cost Bridge
- Copper and Aluminium Winding Costs: Metal Pass-Through and Indexation in 2026
- GOES Electrical Steel Economics: Yield, Loss and Grade Premium in 2026
- Mineral Oil versus Natural Ester: Transformer Life-Cycle Cost Boundaries in 2026
- Lithium, Nickel and Graphite Exposure: Battery Procurement Cost Bridges in 2026
- Recycled Copper Economics: Quality, Recovery Yield and Energy Cost in 2026
- Transformer landed cost: Incoterms, ocean freight, road delivery and insurance in 2026
- Transformer heavy haul: route, permits, storage and remobilization costs
- LNG shipping economics: freight, boil-off and delivered energy cost
- Port delay economics: working capital, storage and equipment demurrage
- Diesel and bunker freight surcharges: an auditable indexation model
- Solar LCOE: Financing, Curtailment and Interconnection in 2026
- Wind Capture Price: Congestion, Export Losses and Revenue
- BESS Arbitrage: Throughput, Degradation and Net Spread
- Industrial Power PPAs: Fixed, Floating and Profile Risk
- Transformer Losses: Capital Premium, Electricity Cost and NPV
- Refinery hydrogen: separate gas, electricity and carbon costs
- LNG liquefaction: electric-drive versus gas-turbine energy cost
- Oilfield ESP economics: water cut changes the oil-cost denominator
- Gas-generator spark spread: net heat rate turns fuel into cost
- Liquid-pipeline pumping: electricity versus diesel cost scenarios
- Copper Mine Energy Cost: Grade and Recovery Matter More Than a Headline Tariff
- SAG Mill Economics: Lower kWh/t Must Preserve Throughput and Recovery
- Mine Conveyor or Haul Trucks: Energy Prices and the Throughput Break-Even
- Mine Dewatering Cost: Total Head and Wire-to-Water Efficiency
- Mine Power Reliability: Value Outage Hours, Restart Losses and Backup Costs Separately
- SFRA After Transformer Transport: Distinguishing Winding Movement from a Changed Setup
- Transformer Moisture: Why the Same ppm Means Different Risk in Mineral Oil and Ester
- Bushing Capacitance and tan δ: Build a Temperature-Consistent Trend Before Replacement
- OLTC Dynamic Resistance: Diagnose Transition-Resistor Signatures Without False Alarms
- Transformer Winding Resistance: Correct Temperature Before Comparing Phases and Factory Data
- Restricted Earth Fault: Proving the Transformer Neutral CT Zone
- GOOSE with PRP or HSR: Supervise the Trip, Not Just the Link
- 1 A or 5 A CT Secondaries: Calculate the Long-Cable Burden
- MV Breaker Failure 50BF: Build the Timer and Intertrip Budget
- NGR Continuity Monitoring: Respond to an Open or Bypassed Resistor
- BESS Transformer RFQs: Evaluate Losses Against the Actual Duty Cycle
- MV Collector Protection When Inverter Fault Current Barely Exceeds Load
- Grid-Forming BESS Black Start: Prove Transformer Energization Before Load Pickup
- Dual-LV Solar Transformers: Specify Every Pairwise Impedance and Its Base
- Renewable Collector Harmonic Scans: Include Cable Capacitance and Converter Impedance
- Refinery Voltage-Sag Ride-Through: Coordinating VFDs, Contactors and Process Permissives
- LNG Compressor Starting: A Transformer Study for Voltage Dip and Acceleration
- ESP Drives, Step-Up Transformers and Long Cables: Separating Resonance from Voltage Drop
- Pressurized Electrical Rooms in Hazardous Areas: Purge, Pressure-Loss and Trip Interfaces
- Refinery UPS Selectivity: Static Bypass, Inverter Limits and Branch Fault Clearing
- Underground Trailing Cables: Coordinate Ground Check and Neutral Protection
- Downhill Conveyor Regeneration: Specify the Transformer and Grid Interface
- Mine Hoist Transformers: Use RMS Cycle Screening Without Hiding Hot Spots
- SAG Mill Drive Transformers: Coordinate Harmonics, Filters and Network Impedance
- High-Altitude Mining Transformers: Separate Clearance and Cooling Guarantees
- Short-Circuit Test Reports: Proving Similarity to the Offered Transformer
- Transformer Noise Guarantees: Sound Power, Sound Pressure and Acceptance
- Ester Retrofill Review: Gaskets, OLTC Approval and the Remaining Mineral Oil
- Reusing a 50/60 Hz Transformer: V/Hz Is Only the First Check
- EU F-Gas Switchgear Procurement in 2026: Rated Voltage and Evidence Scope
- Ecodesign Tier 2 Transformer Standards: No-Load and Load-Loss Limits
- No-Load Loss (P0) Reduction Physics: Laser-Scribed CRGO vs Amorphous Alloy Cores
- Transformer Load Loss (Pk) Optimization: CTC Conductors and Stray Loss Mitigation
- Cast Resin Dry-Type vs Liquid-Immersed Transformers: Selection Guide
- Forced Air (AF) Cooling Dynamics in Cast Resin Transformers: +40% Power Uprating
- Partial Discharge (PD) Testing and Diagnostics in Cast Resin Transformers
- Ester Dielectric Fluids in Power Transformers: Natural vs Synthetic Esters vs Mineral Oil
- Transformer Thermal Modeling and Winding Hot-Spot Calculation (IEC 60076-2 / IEC 60076-7)
- Conservator Preservation Systems, Buchholz Relays, and DGA Duval Triangle Diagnostics
- Step-Up Transformer Engineering for Utility Solar PV, Wind and BESS Plants
- Wind Turbine Nacelle and Tower Transformers: 3G Vibration and Marine Corrosion Design
- BESS Battery Energy Storage Coupling Transformers: Four-Quadrant P-Q Operation and dV/dt Stresses
- Substation Step-Down Power Transformers (110 kV to 330 kV): Design & OLTC Regulation
- On-Load Tap Changer (OLTC) Vacuum Technology and Automatic Voltage Regulation (AVR)
- Ultra-High Voltage (UHV 1000 kV) Transformers and SCB18 Dry-Type Technology
- Generator Step-Up (GSU) Transformers: Saturation, Overfluxing (V/Hz), and Tertiary Stabilizing Windings
- Heavy Industry Process Transformers: Electric Arc Furnace (EAF) & Green Hydrogen Rectifiers
- Variable Frequency Drive (VFD) Multi-Pulse Isolation Transformers: Harmonic Cancellation
- Grounding Transformers (Zigzag ZN) and Neutral Earthing Resistors (NGR): Sizing & Fault Duty
- Medium Voltage Switchgear Selection: Air-Insulated (AIS) vs Gas-Insulated (GIS)
- Vacuum Circuit Breaker (VCB) Switching Dynamics: Transient Recovery Voltage (TRV) and RC Snubbers
- Ring Main Units (RMU) for Secondary Distribution: Architecture, CCF Topologies, and Telemetry Automation
- Transformer Differential Protection (ANSI 87T): Biased Slope, Inrush Restraint, and CT Saturation
- IEC 61850 Substation Automation: GOOSE Messaging, Sampled Values (SV), and Process Bus Protection
- Prefabricated and Pad-Mounted Substations: IEC 62271-202 Selection Guide
- Diesel and Gas Generator Sets: ISO 8528 Rating and Selection Guide
- Instrument Transformers: CT and VT Selection for Metering and Protection
- Surge Arresters and Insulation Coordination: IEC 60099-4 / IEC 60071 Guide
- Power Quality and Reactive Compensation: Capacitor Banks, SVC and STATCOM
- Medium-Voltage Cables and Busways: Ampacity, Voltage Drop and Short-Circuit Selection
- Industrial Motor Selection: IEC 60034 Ratings, Starting and IE Efficiency
- UPS, BESS and Critical Power: Autonomy, Topology and Safety Selection
- Transformer FAT and Site Commissioning: IEC 60076 Test Plan
- Mobile Emergency Substations: Rapid Deployment and Interface Selection
- Rail Traction Transformers: AC/DC Supply, Regeneration and Vibration Duty
- Shore Power Transformers: IEC/IEEE 80005-1 HVSC Interface Design
- Mining and Flameproof Transformers: Ex-Zone, Cooling and Protection Selection
- LV Power Switchboards: IEC 61439 Design Verification and Assembly Data
- LV Breakers, Switches, Fuses and Contactors: IEC 60947 Coordination
- Automatic Reclosers and Feeder Automation: IEC 62271-111 Selection
- MV Feeder Protection Settings: 50/51, 67, 79 and IEC 60255 Evidence
- Generator ATS, AMF and Paralleling: ISO 8528 and IEC 60947-6-1
- Power Meters and Power-Quality Monitoring: IEC 61557-12 / 61000-4-30
- PV Inverter Grid Connection: Anti-Islanding, Reactive Power and Transformer Interface
- EV Charging Infrastructure: Transformer Sizing, Protection and IEC 61851
- Pad-Mounted Transformers: Dead-Front Loop-Feed Design, Fusing and IEEE C57.12.26
- Monoblock Concrete Substations: Internal Arc (IAC-AB), Ventilation and IEC 62271-202
- Biogas and Landfill CHP Gensets: Fuel Gas Treatment, Methane Number and ISO 8528
- Synchronous Generator Protection and Grid Code Compliance: ANSI 32, 40, 46, 81 and FRT
- Electrostatic Shielded Solar Transformers: Inverter Harmonics, K-Factor and Ester Oil
- Busbar Differential Protection (ANSI 87B): High-Impedance vs Distributed Numerical Architecture
- Transmission Autotransformers: Delta Tertiary Stabilization, Zero-Sequence Impedance and Sizing
- Amorphous Metal Core Transformers: Fe-Si-B Ribbon Physics, Acoustic Design and Life-Cycle TOC
- Subsurface and Vault-Mounted Distribution Transformers: Flood Protection and IEEE C57.12.40
- Emergency Diesel Generator Fast-Starting: ISO 8528-5 Class G3 Dynamics and NFPA 110
- Submerged Arc Furnace (SAF) Transformers: High-Current Secondary Bus Electrodynamics
- Floating Solar PV (FPV) Transformer Substations: Marine Corrosion, Buoyancy and Tilt
- ETAP Alternative for Single Line Diagrams: A Practical Selection Guide
- How to Create an Electrical Single Line Diagram Online
- Single Line Diagram vs Load-Flow Model: Validation Before Analysis